
For retail chains

You know what a click costs. Not whether anyone walked into the store.

Every month you defend a media budget with half the story. We make the other half visible: where demand sits, by region, before the quarterly numbers tell you.

Fifteen minutes of work on our side, no commitment. You see straight away which buying questions your format is missing from.

Stevin Intelligence Feed
Live
1/3

Measured on 4 September

Ask an AI where to buy a good pan. The chain is not in the answer.

Thirteen buying questions about household goods, put to an AI with live search, aimed at a national chain with hundreds of stores. Twelve without the brand name: where do I buy good kitchen equipment, which shop has a wide range, where do I find sustainable kitchenware in Amsterdam.

0 of 13

times the site of the chain was a source

1 of 12

open questions named the chain

kookwinkel.nl

and other small specialist shops gave the answers

The painful one was the question about the promotions of the chain itself. Even there the answer came from two leaflet sites, not from its own site. Hundreds of stores and decades of name recognition lose to a cookware shop with a good product page. That is not a budget problem, that is a page that does not exist.

Every week without measurement you pay for reach you cannot steer.

Demand in your category moves by region and by week. If your budget is spread evenly across the country, you buy reach where nobody is searching and fall short where it peaks. You see it in the quarterly report, once it is over.

Request the free scan

The scan shows in fifteen minutes where you stand now. Then you decide.

Two things we do not do.

We do not close the bridge to the till

No till data, no footfall measurement. So we will not tell you which ad got someone into the store. Anyone promising that without your point of sale is working from assumptions and calling it measurement.

We do not connect retail media portals

If you also sell through other retailers, we do not connect their portals or manage their feeds. We read your own exports and put them next to the rest, with a definition underneath.

What you do get.

Demand by region, within days

Whether demand for your category is moving, and whether it moves everywhere at the same rate. You see where your budget sits while demand is somewhere else. The earliest signal you can have without a till connection.

The promotion recalculated, with margin

A promotion week sells itself on revenue. We put margin next to it, the week after, and who bought: new customers or people who were coming anyway.

A definition that stays

What counts as a conversion and what does not, recorded with the reason. Owned by your company, not the agency. The next agency inherits it.

What that looks like

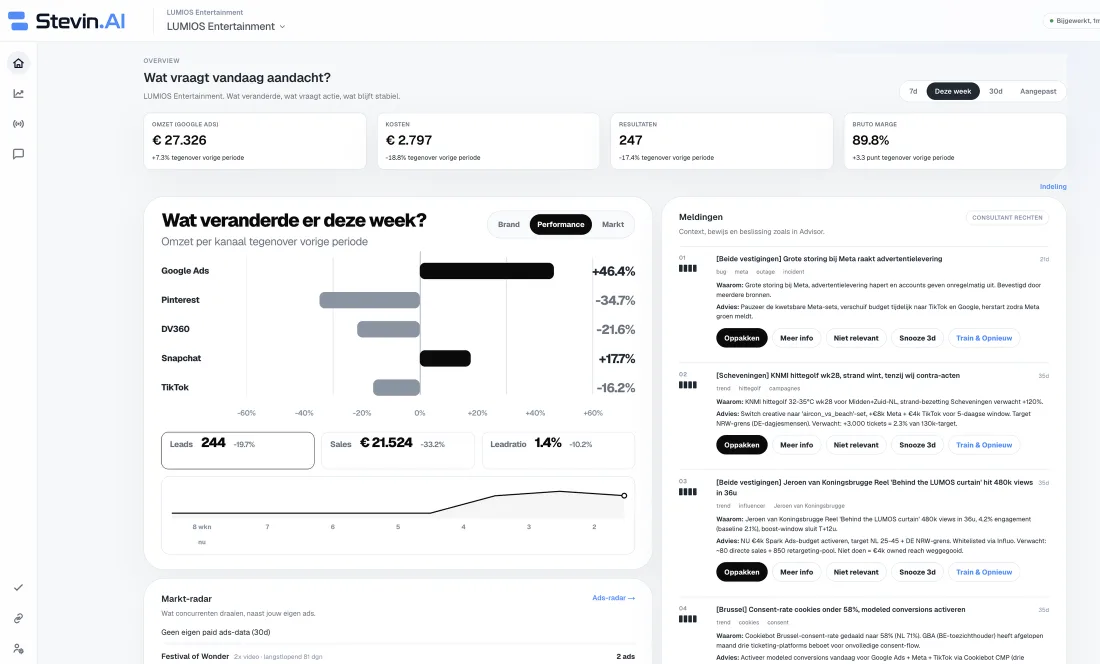
What is going wrong, what is working, and why. On one screen.

Not a report after the fact. Stevin watches what comes in today and what your brand is worth a year from now. Those are two different things, and they rarely sit in the same overview.

The Stevin Desk: alerts with the reason and the advice, numbers per channel and the market radar
07

[South region] Demand is rising where the budget is not

search demandregionbudget

Why: Search volume for your main category has been rising in two regions for three weeks, while the budget is spread evenly across the country. At the stores there you are below your usual impression share, so you are missing demand that exists right now.

Advice: Shift budget to the region where demand is moving, start with one store so you can measure it against the rest, and record what you did and why.

Pick upMore infoNot relevant

From the Stevin Desk. LUMIOS is our demo environment, not client data.

And everything that was tried is still there.

Every campaign, every decision, every result, and what the competition was doing at the time. Including the work that only pays off months later, which is the first thing to drop out of sight. Whoever starts here tomorrow reads up, instead of you explaining it all over again.

A single client memory, the way it sits in the Desk.Drag the nodes around.

Why the advice holds.

Under every piece of advice sits a knowledge layer of 105 principles from published research. Three of them, as they sit in the system, with their limits.

Price discounts are a temporary volume boost with a hidden cost.

They mostly reach existing buyers, teach customers to wait for a discount and raise price sensitivity. A prize draw or a gift lowers it instead.

IPA Databank, Binet and Field

Does not mean price promotions are never allowed, certainly not where retailers impose them, and not that the volume effect is unreal.

A share of media spend above your market share is the strongest known predictor of growth.

So the question is not only whether your own return holds up, but whether your spending moves with the competition.

IPA Databank, Binet and Field

Does not mean more spend always buys proportional growth, and it does not work in fragmented categories without a clear market share.

Build distinctiveness over differentiation.

On average only ten percent of your own buyers see your brand as different. What you can steer: colour, shape, voice, the structure of the leaflet, consistent for years.

Ehrenberg-Bass

Does not mean renewal is impossible. The brand elements stay, the executions vary.

Why we know this.

Built by someone who spent twenty years on the other side of the invoice, as the founder of an agency. With every client that had a shop floor you saw the same thing: a large media budget and a measurement that stopped at the website.

Everyone knew it, and everyone still reported on what could be measured. So this system starts with measuring, with naming what you do not know, and with recording what you tried.

What retailers ask us first.

We already have an agency. Can this run alongside?

Yes. The scan and the diagnosis are a second opinion on your own numbers. If things are right, you now know for sure. If not, you have something concrete to discuss with your agency. We change nothing in your accounts.

What if the scan shows everything is fine?

Then we say so. A museum we measured this week came out mostly as good news, and that is what its page says. A scan that may only deliver bad news is not a measurement.

What does it cost?

The scan is free. After that you choose: monitoring only from 399 a month, or the full diagnosis on your own data. You keep the report, even if you do nothing further with us.

Start with the scan.

Fifteen minutes. No access to your accounts needed. You see which buying questions your format is missing from, and who is there instead.

Fifteen minutes of work on our side, no commitment. You see straight away which buying questions your format is missing from.